
1989 AMC 8 Problema 19
Intenta el Problema 19 del 1989 AMC 8 a continuación y luego compara tu respuesta con la solución preparada profesionalmente de LIVE by Po-Shen Loh. También puedes intentar el examen cronometrado completo, ver todas las soluciones del 1989 AMC 8, o revisar la clave de respuestas.
Todos los problemas se usan con el permiso legal oficial de la Mathematical Association of America (MAA).
19.
La gráfica muestra el gasto acumulado, en millones de dólares, del gobierno de Surf City durante Por ejemplo, para principios de febrero se habían gastado alrededor de millones y para finales de abril aproximadamente millones. ¿Aproximadamente cuántos millones de dólares se gastaron durante los meses de verano de junio, julio y agosto?
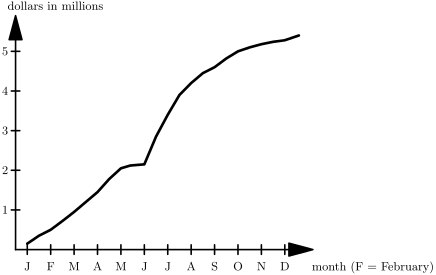
The graph below shows the total accumulated dollars (in millions) spent by the Surf City government during For example, about million had been spent by the beginning of February and approximately million by the end of April. Approximately how many millions of dollars were spent during the summer months of June, July, and August?
Respuesta: B
Pista pequeña:
Como la gráfica muestra un total acumulado, lo gastado en un lapso de meses es el aumento de ese total a lo largo del lapso
Because the graph shows an accumulated total, the amount spent over a span of months is the increase in that total across the span
Pista grande:
Lee la altura de la curva al comienzo de junio y al final de agosto, y luego resta los dos valores
Read the height of the curve at the beginning of June and at the end of August, then subtract the two values
Solución:
La gráfica da el gasto total acumulado, así que lo gastado durante junio, julio y agosto es igual al total acumulado al final de agosto menos el total acumulado al comienzo de junio.
La curva está un poco por encima de millones al comienzo de junio y un poco por encima de millones para finales de agosto. La diferencia es de aproximadamente millones.
Por lo tanto, la respuesta correcta es B.
The graph gives the total accumulated spending, so the amount spent during June, July, and August equals the accumulated total at the end of August minus the accumulated total at the beginning of June.
The curve is at a bit more than million at the beginning of June and a bit more than million by the end of August. The difference is about million.
Thus, the correct answer is B .
El Problema 19 en otros años
- 1985 AMC 8
- 1986 AMC 8
- 1987 AMC 8
- 1988 AMC 8
- 1990 AMC 8
- 1991 AMC 8
- 1992 AMC 8
- 1993 AMC 8
- 1994 AMC 8
- 1995 AMC 8
- 1996 AMC 8
- 1997 AMC 8
- 1998 AMC 8
- 1999 AMC 8
- 2000 AMC 8
- 2001 AMC 8
- 2002 AMC 8
- 2003 AMC 8
- 2004 AMC 8
- 2005 AMC 8
- 2006 AMC 8
- 2007 AMC 8
- 2008 AMC 8
- 2009 AMC 8
- 2010 AMC 8
- 2011 AMC 8
- 2012 AMC 8
- 2013 AMC 8
- 2014 AMC 8
- 2015 AMC 8
- 2016 AMC 8
- 2017 AMC 8
- 2018 AMC 8
- 2019 AMC 8
- 2020 AMC 8
- 2022 AMC 8
- 2023 AMC 8
- 2024 AMC 8
- 2025 AMC 8
- 2026 AMC 8