
1993 AMC 8 第 11 题
先试着解答 1993 AMC 8 第 11 题,然后核对你的答案与精心整理的解答,解答来自 LIVE by Po-Shen Loh。你也可以参加完整限时模拟考试、查看全部 1993 AMC 8 解答,或核对答案。
所有题目均经美国数学协会(MAA)官方合法授权使用。
11.
这张直方图表示 名学生的考试分数。中位数落在哪个标号的区间中?
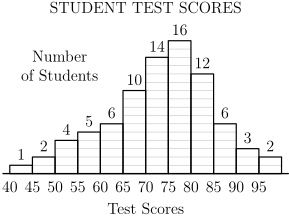
Consider this histogram of the scores for students taking a test. The median is in the interval labeled which value?
小提示:
个分数按从低到高排列时,中位数是第 个分数
With scores in order, the median is the middle one: the st score counting from the lowest
大提示:
从左到右累加各柱的高度,直到累计人数第一次达到或超过
Add the bar heights from left to right until the running total first reaches
解答:
因为有 名学生,中位数是从低到高数的第 个分数。
从左往右累加柱高,累计人数为 、、、、、、、。累计数第一次超过 时位于标号 的区间,其中包含第 到第 个分数。所以第 个分数在标号 的区间中。
所以正确答案是 C。
Since students took the test, the median is the st score counting up from the lowest.
Adding the bar heights from the left gives running totals The total first passes at the interval labeled which contains the th through nd scores. So the st score lies in the interval labeled
Thus, the correct answer is C .
其他年份的第 11 题
1985 AMC 8 · 1986 AMC 8 · 1987 AMC 8 · 1988 AMC 8 · 1989 AMC 8 · 1990 AMC 8 · 1991 AMC 8 · 1992 AMC 8 · 1994 AMC 8 · 1995 AMC 8 · 1996 AMC 8 · 1997 AMC 8 · 1998 AMC 8 · 1999 AMC 8 · 2000 AMC 8 · 2001 AMC 8 · 2002 AMC 8 · 2003 AMC 8 · 2004 AMC 8 · 2005 AMC 8 · 2006 AMC 8 · 2007 AMC 8 · 2008 AMC 8 · 2009 AMC 8 · 2010 AMC 8 · 2011 AMC 8 · 2012 AMC 8 · 2013 AMC 8 · 2014 AMC 8 · 2015 AMC 8 · 2016 AMC 8 · 2017 AMC 8 · 2018 AMC 8 · 2019 AMC 8 · 2020 AMC 8 · 2022 AMC 8 · 2023 AMC 8 · 2024 AMC 8 · 2025 AMC 8 · 2026 AMC 8