
1993 AMC 8 第 5 题
先试着解答 1993 AMC 8 第 5 题,然后核对你的答案与精心整理的解答,解答来自 LIVE by Po-Shen Loh。你也可以参加完整限时模拟考试、查看全部 1993 AMC 8 解答,或核对答案。
所有题目均经美国数学协会(MAA)官方合法授权使用。
5.
下列哪个条形图可能表示所示扇形图中的数据?
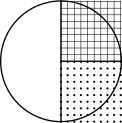
Which one of the following bar graphs could represent the data from the circle graph shown?


小提示:
判断圆中三个区域分别占整个圆的几分之几
Decide what fraction of the whole circle each of the three regions takes up
大提示:
每个涂色区域都是四分之一,未涂色区域是一半,所以三根条形高度的比例应为
Each shaded region is a quarter and the unshaded region is a half, so the three bars should have heights in the ratio
解答:
两个涂色区域各占圆的四分之一,未涂色区域占一半。所以三个数量的比例是 ,即 。
相应条形图必须有两个涂色条高度相等,白色条高度正好是它们的两倍。只有一个条形图符合这些条件。
所以正确答案是 C。
The two shaded regions are each one quarter of the circle, and the unshaded region is one half. So the three quantities are in the ratio or
A matching bar graph must have the two shaded bars equal in height and the unshaded bar exactly twice as tall. Only one bar graph has two equal shaded bars with the white bar double their height.
Thus, the correct answer is C .
其他年份的第 5 题
1985 AMC 8 · 1986 AMC 8 · 1987 AMC 8 · 1988 AMC 8 · 1989 AMC 8 · 1990 AMC 8 · 1991 AMC 8 · 1992 AMC 8 · 1994 AMC 8 · 1995 AMC 8 · 1996 AMC 8 · 1997 AMC 8 · 1998 AMC 8 · 1999 AMC 8 · 2000 AMC 8 · 2001 AMC 8 · 2002 AMC 8 · 2003 AMC 8 · 2004 AMC 8 · 2005 AMC 8 · 2006 AMC 8 · 2007 AMC 8 · 2008 AMC 8 · 2009 AMC 8 · 2010 AMC 8 · 2011 AMC 8 · 2012 AMC 8 · 2013 AMC 8 · 2014 AMC 8 · 2015 AMC 8 · 2016 AMC 8 · 2017 AMC 8 · 2018 AMC 8 · 2019 AMC 8 · 2020 AMC 8 · 2022 AMC 8 · 2023 AMC 8 · 2024 AMC 8 · 2025 AMC 8 · 2026 AMC 8