
2000 AMC 8 Problem 4
Attempt Problem 4 of the 2000 AMC 8 below, then check your answer against the professionally curated solution from LIVE by Po-Shen Loh. You can also try the full timed exam, view all 2000 AMC 8 solutions, or check the answer key.
All problems are used with official legal permission of the Mathematical Association of America (MAA).
4.
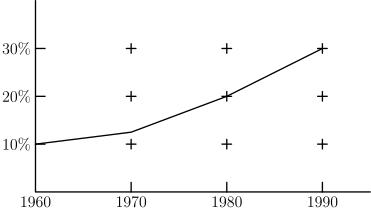
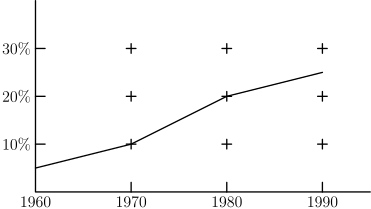
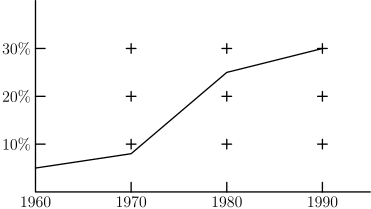
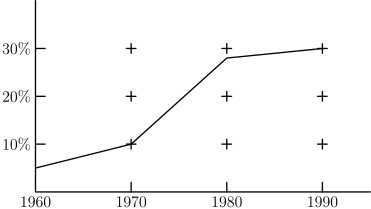
In only of the working adults in Carlin City worked at home. By the “at-home” work force had increased to In there were approximately working at home, and in there were The graph that best illustrates this is
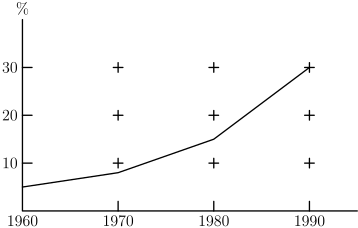
Answer: E
Small Hint:
Match the four percentages to the four years
Big Hint:
The plotted values should rise from about to
Solution:
The only graph that shows all the data points is graph E .
Thus, E is the correct answer.
Problem 4 in Other Years
1985 AMC 8 · 1986 AMC 8 · 1987 AMC 8 · 1988 AMC 8 · 1989 AMC 8 · 1990 AMC 8 · 1991 AMC 8 · 1992 AMC 8 · 1993 AMC 8 · 1994 AMC 8 · 1995 AMC 8 · 1996 AMC 8 · 1997 AMC 8 · 1998 AMC 8 · 1999 AMC 8 · 2001 AMC 8 · 2002 AMC 8 · 2003 AMC 8 · 2004 AMC 8 · 2005 AMC 8 · 2006 AMC 8 · 2007 AMC 8 · 2008 AMC 8 · 2009 AMC 8 · 2010 AMC 8 · 2011 AMC 8 · 2012 AMC 8 · 2013 AMC 8 · 2014 AMC 8 · 2015 AMC 8 · 2016 AMC 8 · 2017 AMC 8 · 2018 AMC 8 · 2019 AMC 8 · 2020 AMC 8 · 2022 AMC 8 · 2023 AMC 8 · 2024 AMC 8 · 2025 AMC 8 · 2026 AMC 8