
1993 AMC 8 Problem 10
Attempt Problem 10 of the 1993 AMC 8 below, then check your answer against the professionally curated solution from LIVE by Po-Shen Loh. You can also try the full timed exam, view all 1993 AMC 8 solutions, or check the answer key.
All problems are used with official legal permission of the Mathematical Association of America (MAA).
10.
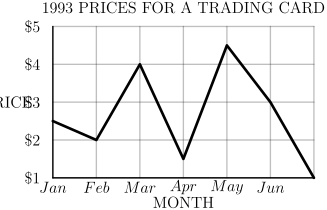
This line graph represents the price of a trading card during the first months of The greatest monthly drop in price occurred during which month?
January
March
April
May
June
Answer: B
Small hint:
A drop happens where the line goes down from one month to the next; measure how far it falls each time
Big hint:
Compare only the downward segments and find the steepest one
Solution:
The price changes month to month are: January (drop ), February (rise), March (drop ), April (rise), May (drop ), and June (drop ).
The largest drop is which occurred during March.
Thus, the correct answer is B .
Problem 10 in other years
- 1985 AMC 8
- 1986 AMC 8
- 1987 AMC 8
- 1988 AMC 8
- 1989 AMC 8
- 1990 AMC 8
- 1991 AMC 8
- 1992 AMC 8
- 1994 AMC 8
- 1995 AMC 8
- 1996 AMC 8
- 1997 AMC 8
- 1998 AMC 8
- 1999 AMC 8
- 2000 AMC 8
- 2001 AMC 8
- 2002 AMC 8
- 2003 AMC 8
- 2004 AMC 8
- 2005 AMC 8
- 2006 AMC 8
- 2007 AMC 8
- 2008 AMC 8
- 2009 AMC 8
- 2010 AMC 8
- 2011 AMC 8
- 2012 AMC 8
- 2013 AMC 8
- 2014 AMC 8
- 2015 AMC 8
- 2016 AMC 8
- 2017 AMC 8
- 2018 AMC 8
- 2019 AMC 8
- 2020 AMC 8
- 2022 AMC 8
- 2023 AMC 8
- 2024 AMC 8
- 2025 AMC 8
- 2026 AMC 8