
1992 AMC 8 Problem 11
Attempt Problem 11 of the 1992 AMC 8 below, then check your answer against the professionally curated solution from LIVE by Po-Shen Loh. You can also try the full timed exam, view all 1992 AMC 8 solutions, or check the answer key.
All problems are used with official legal permission of the Mathematical Association of America (MAA).
11.
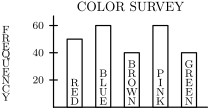
The bar graph shows the results of a survey on color preferences. From left to right, the bars represent red, blue, brown, pink, and green. What percent preferred blue?
Answer: B
Small Hint:
Add the five counts to get the total number of people surveyed
Big Hint:
The percent preferring blue is (blue count) divided by (total), converted to a percent
Solution:
The total number surveyed is
The percent preferring blue is
Thus, the correct answer is B .
Problem 11 in Other Years
1985 AMC 8 · 1986 AMC 8 · 1987 AMC 8 · 1988 AMC 8 · 1989 AMC 8 · 1990 AMC 8 · 1991 AMC 8 · 1993 AMC 8 · 1994 AMC 8 · 1995 AMC 8 · 1996 AMC 8 · 1997 AMC 8 · 1998 AMC 8 · 1999 AMC 8 · 2000 AMC 8 · 2001 AMC 8 · 2002 AMC 8 · 2003 AMC 8 · 2004 AMC 8 · 2005 AMC 8 · 2006 AMC 8 · 2007 AMC 8 · 2008 AMC 8 · 2009 AMC 8 · 2010 AMC 8 · 2011 AMC 8 · 2012 AMC 8 · 2013 AMC 8 · 2014 AMC 8 · 2015 AMC 8 · 2016 AMC 8 · 2017 AMC 8 · 2018 AMC 8 · 2019 AMC 8 · 2020 AMC 8 · 2022 AMC 8 · 2023 AMC 8 · 2024 AMC 8 · 2025 AMC 8 · 2026 AMC 8